MAKEWORLDS TEAM · TECHNICAL REPORT

From photographs
to Gaussian scenes.

A system overview and selected experiments in image-based reconstruction across Mac, Linux and Windows.

3 selected scenesMac · Linux · WindowsTested 2026-10-01Candidate bb039199

Abstract

Image-based reconstruction connects camera geometry, scene representation and image formation. This report describes the MakeWorlds workflow at the system level, from input photographs to a delivered Gaussian scene. It introduces the public concepts behind the representation and explains how visual comparisons and numerical evaluation answer different questions. Experiments on Train, Dr Johnson and Playroom report image quality and cross-platform variation for a fixed candidate, with the published 3DGS values as reference points.

Topics Image-based reconstruction · Gaussian splatting · Camera estimation · Cross-platform evaluation

01 / SYSTEM OVERVIEW

A connected reconstruction workflow

The task is to recover a scene that can explain photographs taken from different positions. A useful result depends on both the estimated cameras and the learned scene: their relationship determines how a three-dimensional model becomes an image.

  1. 01

    Photographs

    Multiple observations of one scene

  2. 02

    Camera estimation

    Relate images to a shared scene

  3. 03

    Scene optimization

    Fit a Gaussian representation

  4. 04

    Scene delivery

    Export the Gaussian PLY result

  5. 05

    Evaluation

    Compare rendered and reference views

Figure 1. Conceptual data flow for the photograph studies. This summarizes the workflow, rather than the internal execution schedule.

Geometry before appearance

Camera estimation establishes the viewpoint associated with each image. Intrinsics describe the camera projection, while extrinsics relate the camera to scene coordinates. Structure-from-Motion provides this geometric context; the COLMAP documentation describes the underlying reconstruction problem.

A concrete output to inspect

MakeWorlds carries the reconstruction through to a Gaussian PLY asset. The visual study pairs images from the delivered scene with their reference photographs. This gives readers an observable result alongside the numerical summary.

02 / TECHNICAL BACKGROUND

Representing a scene with Gaussians

A Gaussian scene uses spatial primitives with position, oriented extent, opacity and appearance. These primitives exist in a shared three-dimensional coordinate system and can be projected into a chosen camera. This representation is established in the 3D Gaussian Splatting paper.

During scene fitting, rendered views are compared with observed images. Changing the scene parameters changes the rendered images, allowing image disagreement to guide optimization. The expression alongside gives the standard spatial Gaussian used to describe the primitive in that literature.

Spatial Gaussian · public formulation

g(x) = exp[−½(x − μ)ᵀ Σ⁻¹(x − μ)]

μ
Centre of the primitive
Σ
Covariance: spatial extent and orientation
Background: Kerbl et al., 2023, §4. Opacity and appearance accompany the spatial primitive.

03 / QUALITATIVE STUDY

Train

Tanks and Temples · 301 photographs

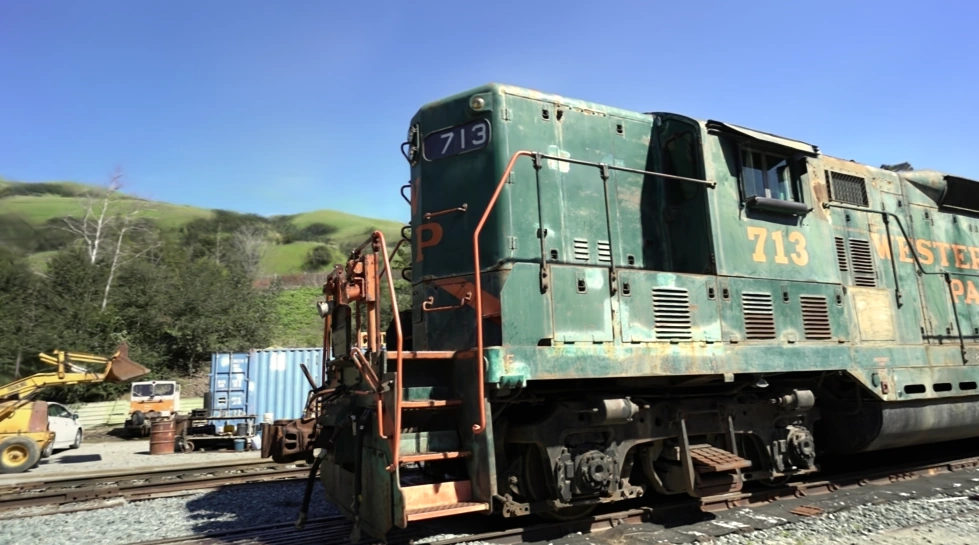
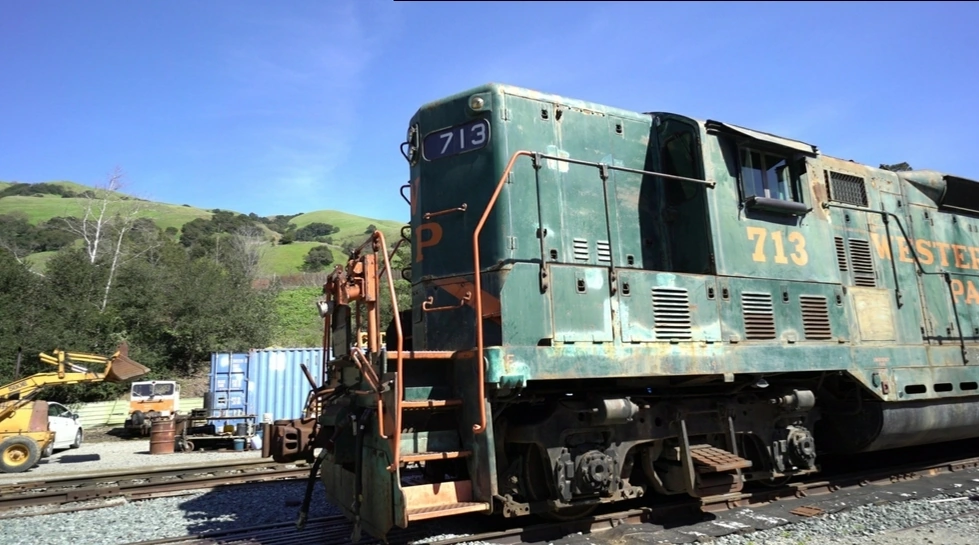
A locomotive reconstructed from photographs. Compare the delivered scene with the original photograph at the same test viewpoint.

MakeWorlds render of the Train locomotive, front and bodyMakeWorlds render
Original photograph of the same Train front and body viewpointOriginal photograph

Mac · view-000009Selected display views; metrics below use evaluated test-view means.

04 / EXPERIMENTAL DESIGN

What is being measured?

Camera estimation, scene quality and platform variation address different parts of the reconstruction problem.

Image comparison and view selection

Each image pair uses one evaluated camera viewpoint. The display views highlight overall shape, an oblique overview and side texture. Numerical summaries instead aggregate the evaluated test views, so they do not depend on which images appear in the visual study.

Two evaluation questions

The paper-comparison table places the recorded PSNR, SSIM and LPIPS beside published per-scene reference values. MakeWorlds estimates its own cameras, so these figures describe an end-to-end reconstruction comparison. The separate cross-platform record asks how far the test-set means vary across the three platform runs.

Why the two tables are separate

The cross-platform spread is computed within its own evaluation protocol. It should not be reconstructed by subtracting values from the paper-comparison table. Keeping the protocols separate preserves what each measurement actually describes.

Settings
Medium · source resolution · 30,000 steps
Hardware
Mac: Apple M4 Max. Linux and Windows: NVIDIA RTX 4090.
Snapshot
2026-10-01 · candidate bb039199
Comparison
Published 3DGS paper values at 30,000 steps. No colour-corrected metrics are substituted into this table.

Reading the evidence

Image-quality metrics characterize this set of reconstructions. Platform spread characterizes agreement of the measured image-quality means; it is not a frame-rate measurement or a claim of byte-identical models. The data files retain the candidate and run identifiers so each row can be traced to its recorded evaluation.

05 / EXPERIMENTAL RESULTS

Selected public scenes

View data ↗

Three scene studies, each measured on three platforms. PSNR and SSIM describe image similarity; LPIPS measures perceptual difference.

Medium · source resolution · 30,000 steps · paper-comparison protocol
SceneSource / platformPSNR ↑ dBSSIM ↑LPIPS ↓
TrainPaper reference21.0970.80200.2180
TrainMac21.2270.84630.1537
TrainLinux21.2820.84790.1528
TrainWindows21.2050.84680.1530
Dr JohnsonPaper reference28.7660.89900.2440
Dr JohnsonMac29.1800.91240.2215
Dr JohnsonLinux29.1700.91010.2267
Dr JohnsonWindows29.2740.90950.2271
PlayroomPaper reference30.0440.90600.2410
PlayroomMac30.3850.91480.2264
PlayroomLinux30.4350.91580.2252
PlayroomWindows30.2050.91370.2268

Higher PSNR / SSIM and lower LPIPS are better. Paper rows are published reference values; MakeWorlds solves its own cameras. These are selected scene results, not an exhaustive benchmark.

Across platforms

Maximum minus minimum PSNR, using the separate cross-platform evaluation protocol.

Train

0.072 dB

Dr Johnson

0.104 dB

Playroom

0.230 dB

06 / REFERENCES

Background & data

Public literature for the underlying concepts, and recorded inputs for the experiments.